
Transport investment is often described as a route to economic growth. Better connections can help people reach jobs, firms reach customers, and places become more productive. But there is a surprisingly difficult question behind that idea:
How much growth does transport investment actually cause?
The question is harder to answer than it first appears. Transport investment is not randomly spread across the country. Governments may invest in places that are already growing, because demand is rising and capacity is stretched, think of major capacity schemes in and around London. Or they may invest in places that are growing more slowly, where transport is part of a wider regeneration or rebalancing agenda. Both are legitimate policy choices, but they make the evidence harder to interpret.
Either way, simple comparisons can be misleading. If investment follows growth, we may overstate its effect. If investment is targeted at slower-growing places, we may understate it.
That was the challenge explored by CEPA for the Department for Transport. DfT needed a clearer evidence base for thinking about transport investment levels and priorities, including a UK-specific estimate of the relationship between transport investment and economic output. The work combined international evidence with new econometric analysis of UK regional data, but the most interesting part came from looking backwards.
UK rail network in 1950 UK rail network in 1950
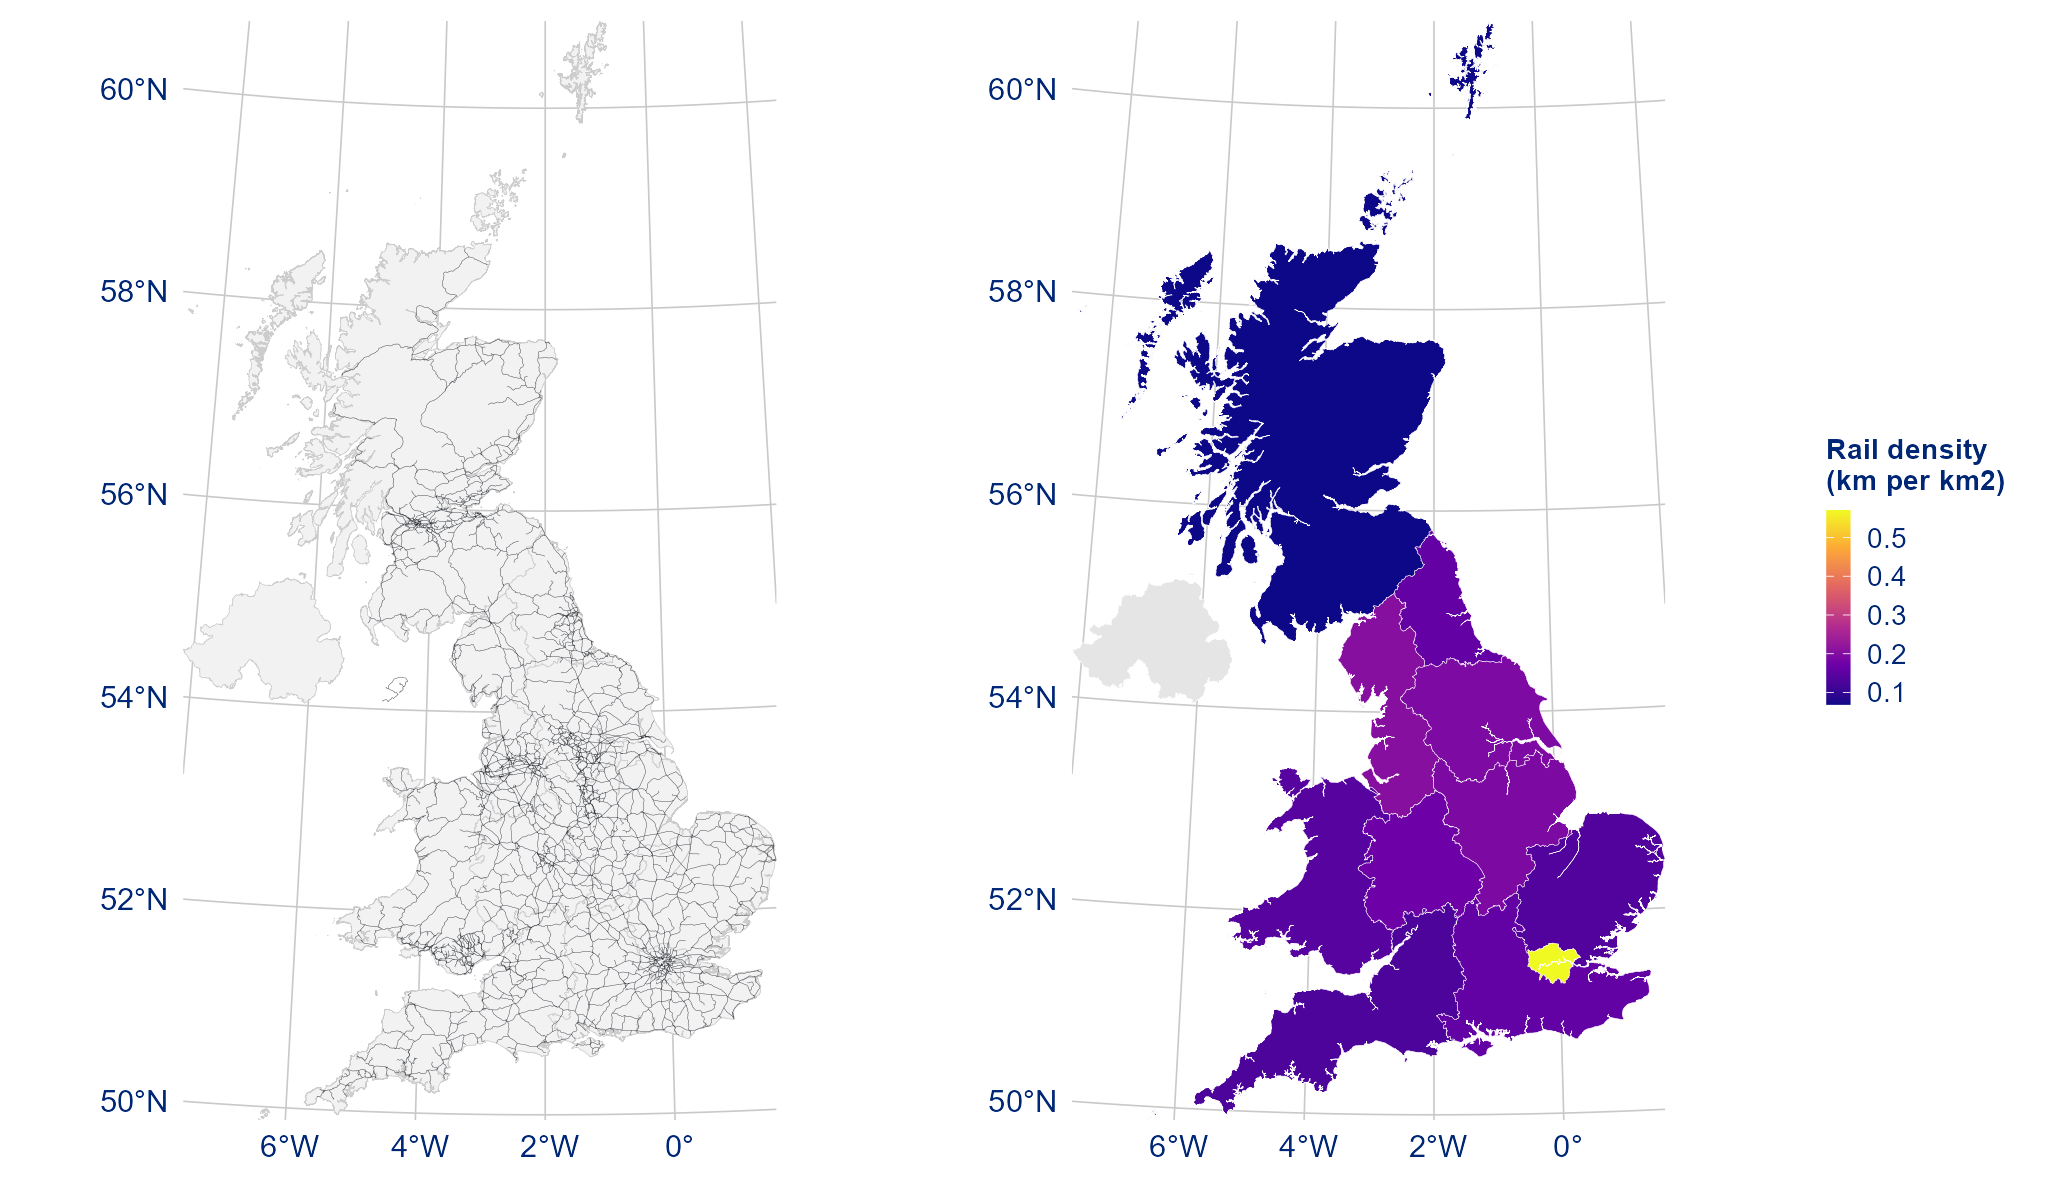
Source: Cambridge Group for the History of Population and Social Structure, Rail shapefile (1950), ITL1 2021 boundaries.
The figure paints a familiar economic story. London stands out, but rail density was not only a London story. Outside the capital, the network was also denser around the manufacturing centres of the North West and the mining areas of Wales. These were places where railways had been built to move people, goods and raw materials through the industrial economy.
That inherited rail geography helped us understand where modern transport investment is likely to flow when national budgets change. Regions with denser legacy rail networks tend to have more assets to maintain, renew and upgrade. So when national transport spending rises, those places are more likely to see an increase in investment, not necessarily because their economies are growing faster today, but because they inherited more of the network in the first place.
This gives us a way to separate investment driven by current regional economic conditions from investment driven by historical infrastructure patterns.
In econometric terms, this was an instrumental variables strategy. In plain English, we asked:
When transport spending increases for reasons linked to inherited infrastructure, rather than current regional growth, what happens to economic output?
The choice of method made a difference. A simple correlation-based analysis found little or no relationship between transport investment and regional growth. But once we used the instrumental variables approach, the results suggested that a 10% increase in transport investment per person was associated with around a 0.7% increase in regional economic output per person.